Journal of Liberal Arts & Interdisciplinary Sciences

 Search
1Faculty of Management Studies, University of Delhi, New Delhi, Delhi, India

Creative Commons Non Commercial CC BY-NC: This article is distributed under the terms of the Creative Commons Attribution-NonCommercial 4.0 License (http://www.creativecommons.org/licenses/by-nc/4.0/) which permits non-Commercial use, reproduction and distribution of the work without further permission provided the original work is attributed.
The world is aging, and South Asia is no exception. Therefore, many issues which were concerned with the young and working population are now matters to the elderly as well, such as the sex ratio. The poor sex ratio is a well-known fact of South Asia, the region as a whole and individual countries too. But often this discussion is broadly limited to “at birth” and “overall population.” However, here we are trying to explore the sex ratio at later life and how its dynamics have changed over the period of time. The analysis utilizes data from the 2019 revision of the World Population Prospects compiled by the United Nations Department of Economic and Social Affairs, covering age- and sex-specific population estimates and life expectancy for 1950–2050. Demographic decomposition analysis was employed to isolate the contributions of population growth and aging, while sex ratio and life expectancy measures were used to assess gender differentials in demographic changes and longevity. Our preliminary results suggest that the poor sex ratio was very much evident in old age as well till the very end of the 20th century. However, women outnumbered men at the beginning of this 21st century, and this will continue in the coming decades. However, this scenario varies from country to country; for instance, India and Sri Lanka are on two different paths and speeds but in the same direction. Even with a surplus sex ratio in later life, South Asia is not equivalent to the developed countries in North America and Europe.
Older person, life expectancy, birth rate, mortality, sex ratio, gender, South Asia
Introduction
The last century’s discussion was mostly focused on some of the crucial events in demography and economics: baby boom, sex ratio, poverty, and unemployment among the youth. In addition, the scientific community and researchers spent a significant amount of time discussing and debating about the short life span of humans in general and developing nations in particular. Due to technological innovation and medical advancements, we were able to control the baby boom. Further, the industrial revolution and technical progress helped to increase productivity and, therefore, employment opportunities. Mass production and industrial uprising led to reduced unemployment, poverty, and finally, government and non-government agencies together were able to meet the health care challenges (Banu, 2016; Dreze & Sen, 2013). However, this phenomenon was more prominent in the advanced economies than in the developing nations. South Asia, a developing region, also saw some improvement in terms of socio-economic and health indicators in the late 20th and early 21st century due to globalization, access to markets by world economic players, and so on. This led to better livelihoods and improvements in the living standards of the Indian Subcontinent population (UNDESA, 2019a; World Bank, 2017).
Population aging has emerged as a major demographic transition in South Asia, driven by sustained declines in fertility and improvements in public health, and rising life expectancy has gradually increased the proportion and absolute number of older persons in the population. Countries across the region are experiencing a transition from relatively young age structures to older populations, although the pace and extent of aging vary considerably (UNDESA, 2019b). This demographic shift has important implications for healthcare, social protection, family support systems, and the broader economic and social organization of society.
Gender imbalance constitutes an important dimension of demographic change in South Asia. Historically, many countries in the region have exhibited an imbalance in the sex composition of the population due to gender-biased mortality, son preference, sex-selective practices, and differences in access to health and nutrition. At old ages, however, the direction of the imbalance may differ because women tend to live longer than men. As a result, gender differences in survival and longevity shape the age-specific sex composition of the population and influence patterns of dependency, widowhood, and care in later life. (Harriss & Watson, 1987).
Despite a growing body of literature on aging and gender, an important gap remains in relation to the old-age sex ratio in South Asia. Existing research has primarily focused on child sex ratio, sex-selective behavior, and gender disparities among younger populations, while comparatively little attention has been devoted to the sex composition of the elderly population. In the 1990s, Amartya Sen wrote about “missing women,” arguing that the female population ratio was considerably lower in developing countries than in more developed countries such as Canada, the USA, the UK, and Australia (Sen, 1990, 1992). However, the situation has improved, but these findings are still relevant to developing regions such as South Asia, where the sex ratio at birth and at younger ages is lower (UNDESA, 2019c). The limited evidence on older-age sex ratios constrains understanding of how gendered survival patterns influence population aging. Consequently, further research is needed to examine trends and variations in sex ratios among older persons and their implications for social and demographic change in the region. To what extent does the lower sex ratio observed in the general population persist among older persons? If such a pattern exists, how has it changed over time, and what is its contemporary and future status? This study aims to addresses these concerns. The second section provides details on the methodology and data source. The third section discusses aging scenario in the South Asia region and member countries. The following section highlights disparities in life expectancy between males and females. Subsequently, the study examines sex ratio at younger and older ages and their changes over time. The discussion section provides an overview of the main findings. Finally, the article ends with concluding remarks and policy prospectives.
Methodology and Data Source
For analytical purposes, the study employed demographic decomposition analysis, life expectancy, and sex ratio. Demographic decomposition analysis was used to identify the relative contribution of population aging and population growth, while life expectancy and sex ratio were examined to understand gender differences in longevity and population composition.
Demographic decomposition analysis was employed to examine how the distribution of the aging population is associated with the annual growth rate of the total and the elderly population. The elderly population was defined as persons aged 65 years and above. The share of the elderly population in the total population was first calculated as:
where At = percentage of the elderly population at time t, Et = elderly population at time t, and Pt = total population at time t.
The annual growth rate of the total population between the two time periods was estimated using the exponential growth formula:
where rp indicates the annual growth rate, P0 is the total population in the initial year, P1 is the defined total population in the later years, and n represents the number of years between the two periods. Similarly, the annual growth rate of the elderly population (e and E) was estimated.
To assess the extent to which population aging was driven by differential growth in the elderly population relative to the total population, the difference between the two growth rates was calculated:

where D indicates the excess growth of the elderly population over the total population. A positive value of D implies that the elderly population is growing faster than the total population, indicating population aging, whereas a negative to near-zero value suggests little or no aging effect.
Life expectancy is the average number of years a person is expected to live, assuming the current age-specific mortality rate remains constant throughout that person’s lifetime. Most commonly, “life expectancy at birth” refers to the average number of years a newborn is expected to live under the prevailing mortality conditions. Life expectancy estimation is carried out using age- and sex-specific mortality data from census, survey, and vital registration systems. In case of incomplete mortality data, life table and Bayesian hierarchical model are considered to estimate female life expectancy first, then derive male life expectancy by modeling the gap between female and male life expectancy.
In the standard table, l0 is usually set equal to 100 {,}000 births, so e0 becomes the total future person-years lived by that synthetic cohort divided by 100 {,}000 (UNDESA, 2022). According to the life table method, life expectancy at age x is calculated as:

where ex = life expectancy at age x
Tx = total person-years lived by the cohort after age x
Lx = number of survivors at exact age x
Here we have considered the life expectancy at 0–4 (e = 0–4) and 65 (x = 65) years.
The sex ratio was estimated as the number of females per 1,000 males in the population. Age-and sex-specific population data were obtained from the relevant census or population projection dataset. For each population group, the total number of females was divided by the total number of males and multiplied by 1,000 (Alam et al., 2012).
where SR is the sex ratio, F is the female population, and M is the male population.
For age-specific groups, such as children (0–4) and the elderly (65+), a similar procedure was applied separately to each age category.
where SRx is the sex ratio for the specific age group x.
The major analytical variables—population distribution, life expectancy, and sex ratio for the period 1950–2050—were obtained from the United Nations Department of Economic and Social Affairs (UNDESA), specifically the 2019 revision of the World Population Prospects database. This source provides internationally comparable estimates and projections of the population by age and sex, as well as life expectancy at birth and at older ages, for all countries and regions. Age- and sex-specific population counts for children and the elderly were extracted to examine changes in population distribution and to calculate sex ratios, while male and female life expectancy estimates were used to assess differences in longevity over time.
Population Aging in South Asia
Economic prosperity and better health systems lead to healthy and longer life expectancy in general and in South Asia in particular. Every 15th person in the Indian Subcontinent is “older,”1 which is about 7% of the total population (over 144 million in the year 2025). This population proportion varies from country to country. To illustrate, Sri Lanka has the highest percentage of older population in the region (i.e., 13.4%), whereas Afghanistan has only 2.9% of its population in this age bracket. However, India’s share precedes the South Asia elderly cohort proportion, with 7.6 percentage older population. The elderly population distribution in Bhutan and Nepal is 6.9% and 6.3%, respectively, whereas in Bangladesh, 6% of the population is aged 65 years and above.
The elderly proportion does not only increase in the future, but this population will grow much faster than the rest. The general population growth rate is about 1.2% per annum, whereas the elderly population will grow by 4.2% annually. Due to this, the number of elderly population will grow much faster in the future, and over 13% of the South Asian population will be old by 2050. It is worthwhile to note that in some of the countries, Sri Lanka and the Maldives, over one-fifth of the population will constitute the elderly cohort. Other nations, such as Bangladesh, India, and Nepal, are following the same pattern with over 13% of the population. In contrast, Pakistan (about 8%) and Afghanistan (over 5%) will have a lower elderly population than the rest of the region, and both still have time to cash in on the demographic dividend (Figure 1).
Figure 1. Population Dynamics among Older Cohorts (Aged 65 Years and Above) in Selected South Asian Countries.
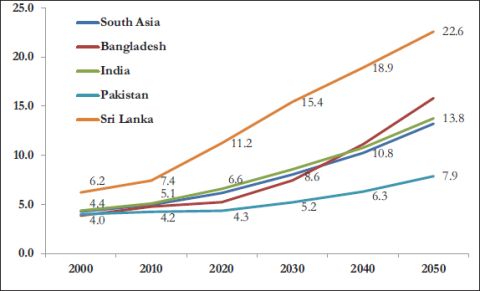
Source: Author’s calculations derived from 2019 data published by UNDESA (2019).
Longevity, Gender, and Older Population
Generally, life expectancy is computed at various stages of life, such as at birth, young, and old. Here, we will mainly focus on life expectancy at younger ages (0–4) and older ages (i.e., 65 years); however, we start our discussion with life expectancy at birth.
The life expectancy (at birth) in South Asia was 37 years in 1950–1955, with the lowest in Nepal (35 years) and the highest in Sri Lanka (55 years). So, the gap among the countries with the lowest and highest life expectancy was about 20 years. This scenario changed by 2000–2005, when South Asia’s life expectancy went up to 64 years, and similar figures were true for India, Nepal, and Pakistan. Further, Sri Lanka retained its first position with 74 years of life expectancy among the South Asian countries. Also, the regional gaps among the countries came down to half, that is, 10 years. However, India went ahead of Pakistan (68 years), with a 70-year life span 2020–2025, but remained behind the South Asia region (71 years), Nepal (72 years), and Sri Lanka (78 years). Moreover, the recent projections of UNDESA reveal that this gap will remain in 2045–2050. To illustrate, Pakistan’s population survival at birth will be 71 years, whereas Sri Lanka’s will be 82 years, Bangladesh’s 79 years, Nepal’s 77 years, and 75 years for both India and South Asia. Over the years, the gap between the highest and lowest life expectancy among the South Asian countries has receded, but it is still 10 years apart.
Old-age (at the age of 65 years) life expectancy was about 10 years in 1950–1955 for most of the South Asian countries, except Pakistan and Sri Lanka (12 and 11 years, respectively). However, Sri Lanka took the lead in terms of later life expectancy with 16 years, followed by Pakistan (14 years) by 2000–2005, and Nepal (13 years) ended up being the country with the lowest life expectancy at the age of 65 years. However, Nepal’s life expectancy (14 years) has improved in recent times, 2020–2025, and now it is parallel to India and Pakistan and only behind Sri Lanka (18 years) and Bangladesh (16 years). Further, Nepal’s old-age life expectancy will be ahead of Pakistan and India in the future. In contrast to life expectancy at birth, where the gap among South Asian countries is decreasing, the old-age life expectancy gap in later life (e65) has increased over time. The gap was 3 years in 1950–1955; however, this has increased to over 4 years by 2020–2025. In addition, this gap will further widen in the future.
As we are aware, life expectancy varies with gender, men and women. Women tend to live longer than their male counterparts. This is mostly due to women’s strong biological structure and higher survival chances than men (Hazzard, 1989). Therefore, this also influences their overall life expectancy (e0), and a similar case can be seen for South Asia, where women’s life expectancy is about 72 years and men’s 69 years as of 2020–2025. This trend is also applicable in old age, where women’s life expectancy is 16 years and men’s is 14 years for South Asia. The additional years of life expectancy for women were less than a year in 1950–1955 for South Asia. This was applicable to most of the countries, except Bangladesh. Further, Sri Lanka and Pakistan reported 3 and 2 additional years of life expectancy for women than men, respectively. South Asian women live 1 year more than their male counterparts. Additional years of women’s survival were higher for India (1.2 years), Nepal (1.2 years), and Sri Lanka (2.8 years) as compared to South Asia. Women’s additional years of life expectancy are 1.1, 1.6, 2.5, and 3.1 years for South Asia, Nepal, Bangladesh, and Sri Lanka, respectively, for 2020–2025. This gap will further widen to approximately 2 years by 2045–2050 for South Asia and India. Elderly women in Sri Lanka, Nepal, and Bangladesh will live 2.6 years more than elderly males in their respective countries. However, this gap will start decreasing from 2045–2050, especially for Sri Lanka, Nepal, and Bangladesh (Figure 2).
Figure 2. Additional Years of Life Expectancy for Women as Compared to Men (e65).
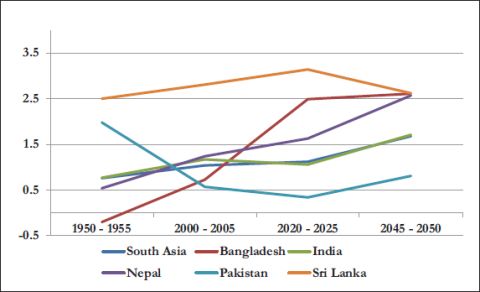
Source: Estimated by the author using data from UNDESA (2019).
A Journey from a Shortage to Surplus Women
As we know, sex ratios in younger ages are lower in developing countries and are particularly true for South Asia, where the son-preference culture is much stronger than education and awareness (Dreze & Sen, 2013). This is largely due to female feticide, lack of nutrition, healthcare, and other facilities for the girl child when she is born and during childhood and adolescence. This sex ratio gap is even wider if we compare it with the developed world, like North America, Europe, and so on, and Amartya Sen called it “missing women” (Sen, 1990, 1992). Similar figures can be seen in Figure 3, where the sex ratio is lower in all countries for both age groups—0–4 and 65+ years—except Nepal, India, and Sri Lanka. However, all countries’ sex ratios dropped in successive years for the age group 0–4 years. However, in some countries, a surplus of women relative to men in older age groups began to emerge in the late 20th century. This shift became more pronounced from around 1995 onward, particularly within the older cohorts, reflecting changes in mortality patterns and increasing female longevity.
After five decades, the sex ratio changed, and most of the South Asian countries are approaching a balanced sex ratio in older age groups, that is, the 65 years and above age group. To illustrate, the surplus sex ratio originated in Sri Lanka and Afghanistan, along with Nepal and India, by 2000. These results are visible in Figure 3, where women outnumbered the men in old age.
This slowly started in the early years of the 21st century and can be seen more prominently in Nepal, Sri Lanka, India, and Afghanistan. Surplus women in old age continue in these countries, and a few other countries have joined them as well, such as the Maldives. Also, the number of women became more substantial for these countries in 2020 as compared to the beginning of the millennium (Figure 4).
The sex ratio among the older population exceeds the earlier estimates by a good number in the countries which we have mentioned earlier. Some of the other countries have also joined the league, such as Pakistan and Bangladesh. These are the countries where aging is more severe as compared to the others (Figure 5).
Figure 3. Sex Ratio of Children and the Elderly in South Asian Countries at the Beginning of the Millennium (2000).
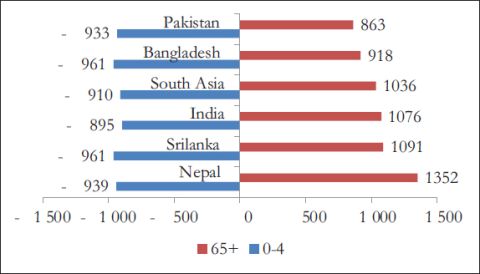
Source: Calculated by the author using 2019 data provided by UNDESA.
Figure 4. Comparison of Sex Ratio among Children and the Elderly in South Asia, 2020.
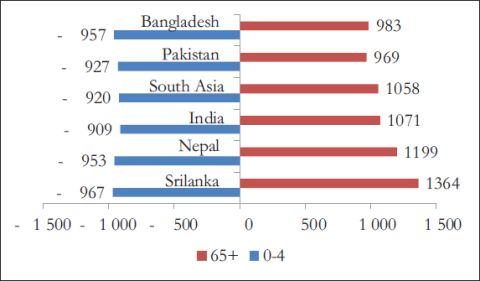
Source: Computed by the author accessing UNDESA (2019) data.
Figure 5. Comparative Differences in Sex Ratio among Children and the Elderly in South Asian Countries by the Mid-21st Century.
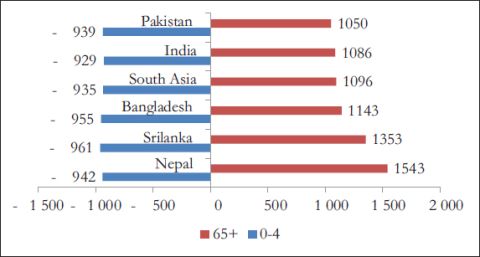
Source: Author’s calculations derived from 2019 data published by UNDESA (2019).
Discussion
Population aging is emerging as a significant demographic phenomenon in the Indian Subcontinent, where approximately 1 in every 15 persons (around 7%) is aged 65 years and above, corresponding to over 144 million individuals in 2025. However, this regional average conceals substantial cross-country variation. For instance, Sri Lanka records the highest share of older persons (13.4%), while Afghanistan remains at a much earlier stage of aging, with only 2.9% of its population in this age group. These differences highlight the uneven pace of demographic transition across South Asia.
The dynamics of aging are further underscored by divergent growth rates between the total and elderly populations. While the general population is growing at approximately 1.2% per annum, the elderly population is expanding at a significantly higher rate of 4.2% annually. This differential implies a rapid acceleration of population aging, with projections indicating that the share of older persons in South Asia will exceed 13% by 2050. Consequently, aging is expected to become a defining demographic feature of the region within the coming decades.
Despite convergence in overall demographic patterns, considerable inter-country variation persists in aging trajectories. The gap in population aging across South Asian countries has narrowed to roughly a decade in demographic terms, reflecting partial convergence in mortality and fertility transitions. Nevertheless, disparities remain evident, particularly in old-age mortality. Life expectancy at age 65 has improved substantially over the past seven decades; however, unlike life expectancy at birth—where cross-country differences are declining—the gap in old-age life expectancy (e65) has widened over time and is projected to increase further in the future.
Gender differences in longevity remain a consistent feature of demographic change in South Asia. During 2020–2025, female life expectancy is approximately 72 years compared to 69 years for males. This gender gap persists into older ages, where women are expected to live an additional 16 years beyond age 65, compared to 14 years for men. Notably, this advantage has expanded considerably over time; in 1950–1955, the female survival advantage in old age was less than one year across South Asian countries.
These mortality differentials have important implications for the sex composition of older populations. The sex ratio among the elderly already exceeds earlier estimates in several countries, notably Sri Lanka (1,364 females per 1,000 males) and Nepal (1,199 females per 1,000 males) in 2020. This trend indicates a pronounced feminization of aging, which is expected to intensify by 2050. By mid-century, women are projected to outnumber men in the older population in Nepal (by 54%), Sri Lanka (35%), Bangladesh (14%), and the broader South Asia region (around 10%). These patterns suggest that countries already experiencing advanced stages of demographic aging are also those where gender imbalances in older cohorts are most pronounced, reinforcing the need to integrate aging and gender perspectives in policy planning.
Conclusion and Policy Perspectives
The study highlights that population aging is becoming a defining demographic feature of the Indian Subcontinent, although the pace and intensity vary significantly across countries. While approximately 7% of the regional population is currently aged 65 years and above, this share is expected to rise rapidly, driven by faster growth in the elderly population compared to the total population. Persistent cross-country differentials remain evident, with early-aging countries such as Sri Lanka contrasting sharply with younger age structures in countries like Afghanistan. The findings further demonstrate that although life expectancy has improved substantially over time, gains at older ages remain uneven and gendered, with women consistently outliving men. This has resulted in a pronounced feminization of aging, particularly in countries already further along the demographic transition. Overall, the evidence suggests that aging in South Asia is not only accelerating but also increasingly shaped by widening disparities in survival and sex composition at older ages.
To conclude, we can say that South Asia not only has 25% of the world’s youth population but also is home to 16% of the elderly. Further, over 15% of the world’s elderly women live in South Asian countries. The missing women case was a last-century outlook; however, with the increasing female population in old age, women outnumbered men. This is more so in the cases of Nepal, Sri Lanka, India, and so on.
In a way, this is good news for women, as they are getting additional years to live as compared to their male counterparts. However, it is essential to ask and note, “Are women living happy and fulfilling lives in these additional years?” Many of the recent scientific studies have shown that women are suffering from non-communicable diseases (NCDs) and have a poor socio-economic well-being in later life (Alam & Yadav, 2014; Alam et al., 2026; Yadav et al., 2019). Their situation further aggravates due to the changing face of the family system in the Indian Subcontinent, where elderly parents are left behind to fend for themselves (Alam & Yadav, 2014).
The rapid and uneven pace of population aging in South Asia calls for differentiated and forward-looking policy responses. Governments must prepare for a sharp increase in the elderly population, which is projected to exceed 13% by 2050, by strengthening health systems, pension coverage, and long-term care infrastructure. Given the higher growth rate of the elderly population relative to the working-age population, policies should also focus on promoting active aging, extending healthy life expectancy, and enhancing older persons’ participation in the economy where feasible.
The marked feminization of aging further necessitates gender-responsive policy frameworks. With women forming a growing majority of the elderly population in countries such as Sri Lanka, Nepal, and Bangladesh, targeted interventions are required to address higher risks of widowhood, economic insecurity, and dependency in old age. Strengthening social protection systems, ensuring universal access to healthcare, and developing community-based elderly care services are essential to mitigate the socioeconomic consequences of aging. Finally, integrating aging into broader development planning is critical to ensuring that demographic change supports, rather than constrains, sustainable and inclusive growth in the region.
Acknowledgments
The author owes a deep debt of gratitude to Professor Francesca Bettio (University of Siena, Italy), Professor B. K. Pradhan (IGIDR, India), and the expert talk attendees at MRIIRS, Faridabad, including faculty members, students, and others. Thanks are due to Professor Durairaj Kumarasamy for his constant support and encouragement for scientific research endeavors. Special thanks to Mr. Vinay Kumar Chaudhary, Mrs. Rina Chaudhary, and their little princes—MNK and ANK Chaudhary—for their unconditional love, continuous care, unwavering support, and endless encouragement. However, the views reflected are personal and not necessarily those of the institution to which the author is affiliated. All errors are the responsibility of the author.
Declaration of Conflicting Interests
The author declared no potential conflicts of interest with respect to the research, authorship, and/or publication of this article.
Funding
The author received no financial support for the research, authorship, and/or publication of this article.
Note
Alam, M., James, K. S., Giridhar, G., Sathyanarayana, K. M., Kumar, S., Siva Raju, S., Syamala, T. S., Subaiya, L., & Bansod, D. W. (2012). Status of elderly in select states of India, 2011. United Nations Population Fund. http://india.unfpa.org/?publications=5828
Alam, M., & Yadav, P. (2014). Financial implication of a universal old age pension in India: An exploration. Think Tank Initiative of the IDRC (International Development Research Centre).
Alam, M., Yadav, P., & Khalid, K. (2026). Leisure, self-care, and productive engagements: Exploring how older adults in India spend an average day. Journal of Social and Economic Development. https://doi.org/10.1007/s40847-025-00486-1
Banu, A. (2016). Human development, disparity and vulnerability: Women in South Asia (Human Development Report Background Paper). UNDP.
Dreze, J., & Sen, A. (2013). An uncertain glory: India and its contradictions. Allen Lane, Penguin Group.
Harriss, B., & Watson, E. (1987). The sex ratio in South Asia. In J. H. Momson & J. Townsend (Eds), Geography of gender in the Third World (pp. 85–115). Butler and Tanner.
Hazzard, W. R. (1989). Why do women live longer than men? Biological differences that influence longevity. Postgraduate Medicine, 85(5), 271–278. https://doi.org/10.1080/00325481.1989.11700672
Sen, A. (1990). More than 100 million women are missing. The New York Review of Books, 37(20), 61–66.
Sen, A. (1992). Missing women. British Medical Journal, 304(6827), 587–588.
United Nations, Department of Economic and Social Affairs, Population Division (2019a). World Population Prospects 2019: Highlights. (ST/ESA/SERA/423). https://doi.org/10.18356/13bf5476-en
United Nations, Department of Economic and Social Affairs, Population Division. (2019b). World Population Prospects 2019, Volume I: Comprehensive Tables (ST/ESA/SERA/426). https://doi.org/10.18356/15994a82-en
United Nations, Department of Economic and Social Affairs, Population Division (2019c). World Population Prospects 2019, Volume II: Demographic Profiles (ST/ESA/SERA/427).: https://doi.org/10.18356/7707d011-en
United Nations, Department of Economic and Social Affairs, Population Division (2022). World Population Prospects 2022: Methodology of the United Nations population estimations and projections. UNDESA/POP/2022/TR/NO.6. https://population.un.org/wpp/assets/Files/WPP2022_Methodology.pdf
World Bank. (2017). World Development Indicators 2017. World Bank.. https://doi.org/10.1596/26447
Yadav, P., Veena, V., Kulkarni, V., & Gaiha, R. (2019). Non-communicable diseases, affluence and gender. Economics & Political Weekly, 54(46), 45–54.
